HPS (Noll 1969) measures the maximum coincidence for harmonics for each spectral frame according to
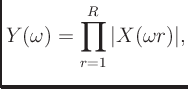 |
(1) |
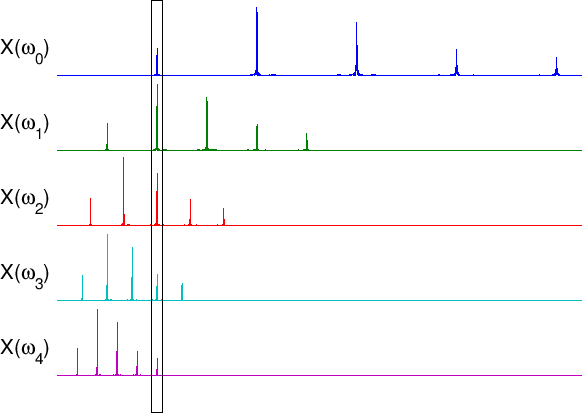
The resulting periodic correlation array ![]() is then
searched for a maximum value of a range of possible fundamental
frequencies
is then
searched for a maximum value of a range of possible fundamental
frequencies ![]()
| (2) |
Octave errors are common (detection is sometimes an octave too high).
To correct, apply this rule: if the second peak amplitude below initially chosent pitch is approximately 1/2 of the chosen pitch AND the ratio of amplitudes is above a threshold (e.g., 0.2 for 5 harmonics), THEN select the lower octave peak as the pitch for the current frame.
Due to noise, frequencies below about 50 Hz should not be searched for a pitch.
Pros: HPS is simple to implement, does well under a wide range of conditions, and runs in real-time.
Cons: low frequency resolution must be enhanced by zero-padding, so that the spectrum can be interpolated to the nearest semitone. This means that high frequencies are also being unecessarily interpolated.
See hps.m