Given the following spectrum, what would be the transfer
function?
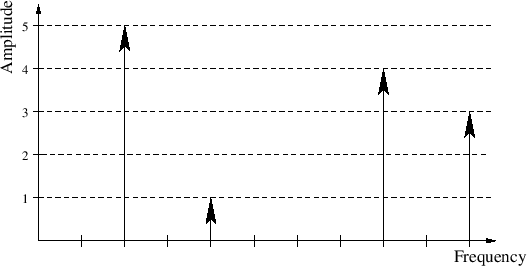
Figure 11:
A steady state spectrum.
|
 |
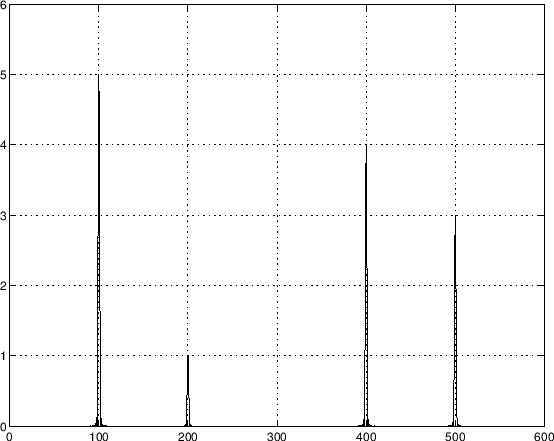
The spectrum contains the first, second, fourth, and fifth
harmonics, with amplitudes 5, 1, 4, 3, respectively.
The transfer function is given by
Figure 12:
The steady state plotted in Matlab.
|
 |
``Music 270a: Waveshaping Synthesis''
by Tamara Smyth,
Department of Music, University of California, San Diego (UCSD).
Download PDF version (waveshaping.pdf)
Download compressed PostScript version (waveshaping.ps.gz)
Download PDF `4 up' version (waveshaping_4up.pdf)
Download compressed PostScript `4 up' version (waveshaping_4up.ps.gz)
Copyright © 2019-03-03 by Tamara Smyth.
Please email errata, comments, and suggestions to Tamara Smyth<trsmyth@ucsd.edu>